Chapters
- 0:00 Introduction
- 0:15 Current Net Worth & Monthly Change
- 0:35 Assets vs. Liabilities Breakdown
- 0:55 Net Worth Over Time Chart
- 1:20 This Month Sidebar
- 1:40 Canadian Benchmarks by Age
- 2:00 Your Composition
- 2:20 Projected Trajectory
TL;DR
Net Worth is the single most important number in personal finance — it's what you own minus what you owe. rogat.ai tracks it automatically, shows you how it changes month over month, plots your trajectory over time, and compares you against Canadian benchmarks by age group. It's the long-term view that puts your day-to-day spending in perspective.
What You'll See
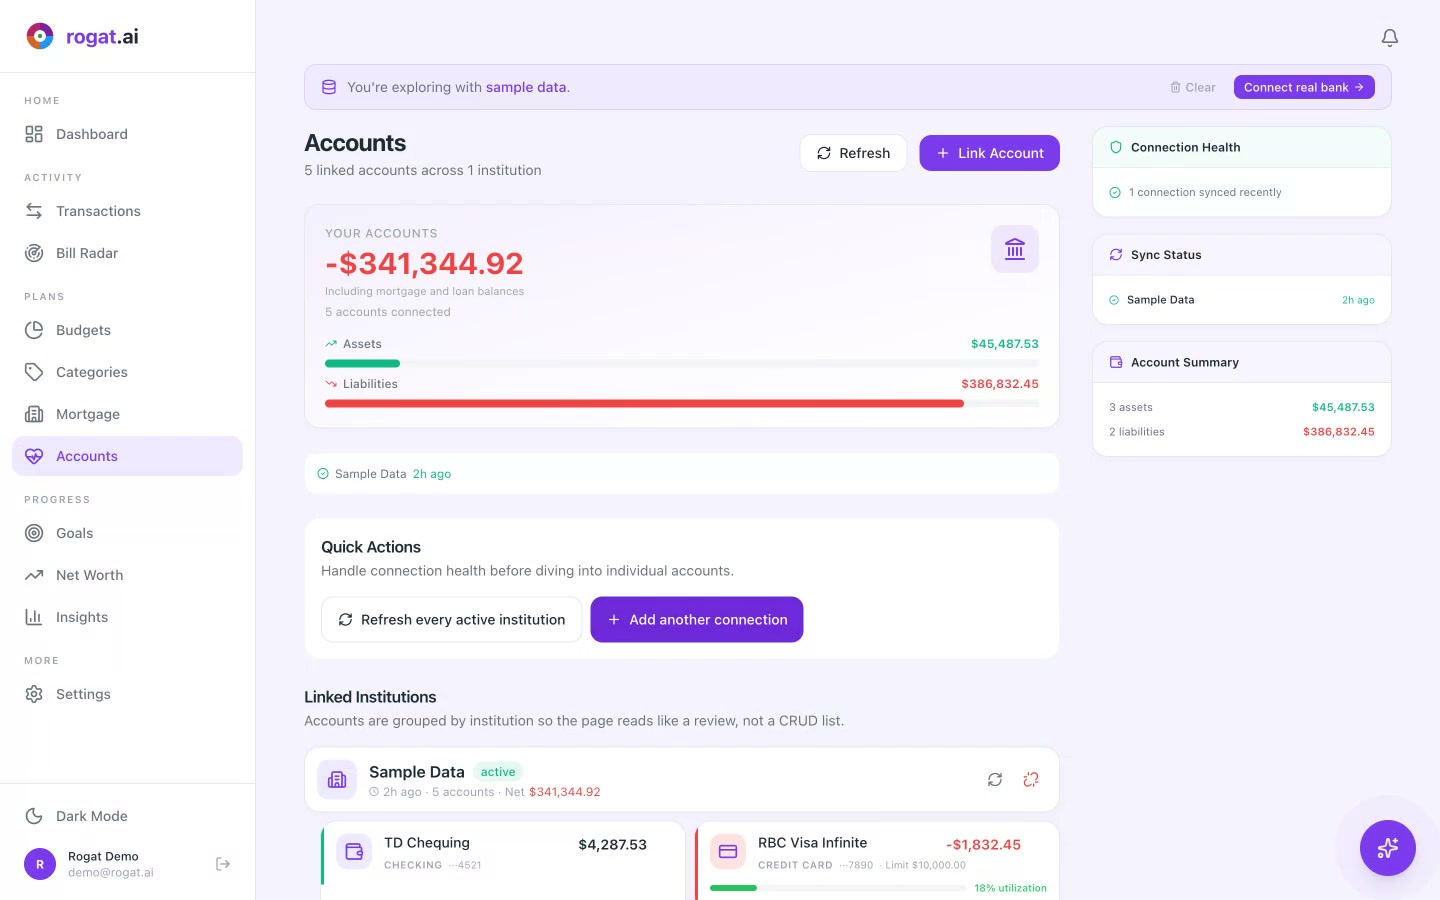
- Current Net Worth — One big number: -$341,344.92. Includes mortgages, loans, and all assets. The monthly change (-$5,687.82, -1.7%) shows short-term movement.
- Context Message — "Your net worth decreased $5,687.82 this month. Short-term dips are normal. What matters is the long-term trajectory." rogat.ai doesn't just show numbers — it provides perspective.
- Assets vs. Liabilities Bar — Visual split: Assets ($45,487.53) vs. Liabilities ($386,832.45). See the ratio at a glance and watch it improve over time.
- Net Worth Over Time — Historical line chart tracking assets, liabilities, net worth, and projected trajectory from month to month. See the trend, not just today's snapshot.
- This Month Sidebar — Quick summary: net worth change, largest asset (Wealthsimple TFSA, $28,750.03), largest liability (BMO Mortgage, $385,000.00).
- Canadian Benchmarks — How do you compare? Median net worth by age: 25-34 ($48,800), 35-44 ($234,400), 45-54 ($521,100), 55-64 ($690,000). Source: Statistics Canada 2023.
- Your Composition — 3 asset accounts ($45,487.53), 2 liabilities ($386,832.45). Updates on account sync, with projection based on 6-month trend.
Why It Matters
When you're paying off a mortgage or student loans, it's easy to feel like you're not making progress. Your net worth might be negative — and that's completely normal. What matters is the direction. A net worth that goes from -$350,000 to -$341,000 over a year means you've built $9,000 in wealth, even though the number is still negative.
The Canadian benchmarks add valuable context. Instead of comparing yourself to influencers on social media, you can see where you stand relative to actual Statistics Canada data for your age group. And the projected trajectory gives you a glimpse of where you're heading if you stay the course.
Tip: Don't check your net worth daily — monthly is ideal. Short-term fluctuations (market dips, bill cycles) create noise. The power of this page is in the long-term trend line.
More Tutorials
Watch Your Wealth Grow
Track your net worth automatically, compare against Canadian benchmarks, and see your long-term trajectory. Sign up free.
Sign Up Free